
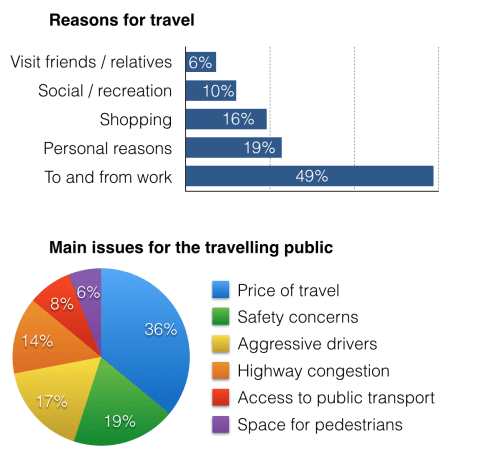
The bar
chart
and pie Use synonyms
chart
Use synonyms
give
information about why US residents travelled and what Change the verb form
gives
travle
problems they experienced in the year 2009.
Correct your spelling
travel
It is clear that
the principal reason why Americans travelled in 2009 was to commute to and from work. In the same year, the primary problem of Americans, with regard to the Linking Words
trips
they made, was the cost of travelling.
Looking more closely at the bar Use synonyms
chart
, we can see that 49% of the Use synonyms
trips
made by Americans in 2009 were for the purpose of commuting. Use synonyms
By contrast
, only 6% of Linking Words
trips
were for visits to friends or relatives, and one in ten Use synonyms
trips
were for social or Use synonyms
recreation
reasons. Shopping accounted for 16% of all Replace the word
recreational
travels
, Fix the agreement mistake
travel
while
personal reasons accounted for the remaining 19%.
Linking Words
According to
the pie Linking Words
chart
, Use synonyms
price
was the key consideration (faktör) for 36% of American travellers. Almost one in five people cited safety as their foremost (önde gelen) travel concern, Add an article
the price
while
Linking Words
aggresive
driving and highway congestion were the main issues for 17% and 14% of the travelling public. Correct your spelling
aggressive
Finally
, a total of 20% of those surveyed thought that access to public transport or space for pedestrians Linking Words
were
the most important travel Correct subject-verb agreement
was
issues
.Fix the agreement mistake
issue