The line graph shows thefts per thousand vehicles in four countries between 1990 and 1999

The line graph shows thefts per thousand vehicles in four countries between 1990 and 1999
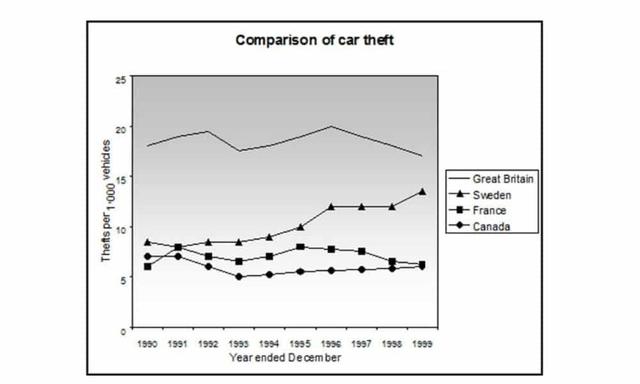
The given line graph illustrates the
amount
Change the quantifier
number
show examples
of stolen vehicles in four countries, namely Great Britain, Sweden, France and Canada over a decade. It can be noticed that the rate of robbery in Great Britain took the lead for the whole period,
whereas
France and Canada showed
opposing
Correct article usage
an opposing
show examples
trend for Sweden. In 1990, The greatest amount of
the
Correct article usage
apply
show examples
theft was in Great Britain.

Unauthorized use and/or duplication of this material without express and written permission from this site’s author and/or owner is strictly prohibited. Excerpts and links may be used, provided that full and clear credit is given to Writing9 with appropriate and specific direction to the original content.

Linking words: Add more linking words.
Basic structure: Write more paragraphs.
Basic structure: Add more body paragraphs.
Common mistake: Your writing should be 150-250 words.
Basic structure: Write more paragraphs.
Vocabulary: Only 6 basic words for charts were used.
Vocabulary: The word "amount" was used 2 times.
What to do next:
Look at other essays: