
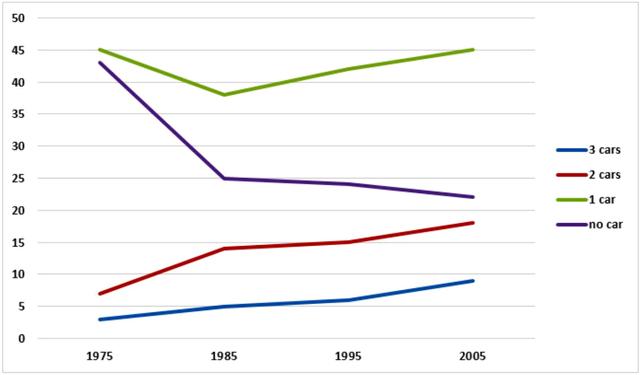
The line graph shows how
car
ownership in the UK changed between 1975 and 2005.
Use synonyms
Overall
, the proportion of Linking Words
people
who owned two or three cars rose Use synonyms
while
the figure for those who owned no Linking Words
car
declined. Use synonyms
Additionally
, having Linking Words
one
Use synonyms
car
was the most common situation during the period shown.
In 1975, nearly half of the UK population had Use synonyms
one
Use synonyms
car
Use synonyms
while
Linking Words
people
with no Use synonyms
car
took up a smaller Use synonyms
percentage
, at roughly 43%. These figures both declined over the following ten Use synonyms
years
, to around 37% for Use synonyms
people
having Use synonyms
one
Use synonyms
car
and 25% for those with no Use synonyms
car
. The Use synonyms
percentage
of those who owned 2 or 3 cars was approximately 7% and 3% respectively in 1975, and both experienced increases over the Use synonyms
next
10 Linking Words
years
to around 13% and 5% respectively.
Over the Use synonyms
next
20 Linking Words
years
, the Use synonyms
percentage
of those with Use synonyms
one
Use synonyms
car
gradually rose back up to 45% Use synonyms
whereas
the Linking Words
percentage
of those with no Use synonyms
car
continued to decline to about 22%. Use synonyms
On the other hand
, the proportion of Linking Words
people
having 2 or 3 cars continued to rise over the following 20 Use synonyms
years
to 19% and 9% respectively.Use synonyms