The graph below shows the proportion of the population aged 65 and over between 1940 and 2040 in three different countries.

The graph below shows the proportion of the population aged 65 and over between 1940 and 2040 in three different countries.
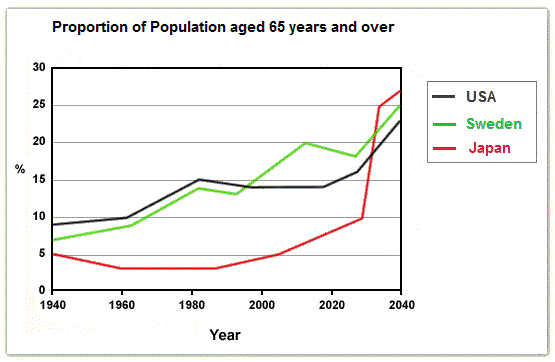
The line graph depicts the percentage of older residents who are part of the USA, SWEDEN and JAPAN countries from 1940 to 2040.
Overall
, it is clearly vivid from the graph that the United States of America and Sweden trends
has
Correct subject-verb agreement
have
show examples
gone through fluctuation as compared to
the
Correct article usage
apply
show examples
Japan. Japan whose population was less in the past years compared to the other countries, but it will beat them in the future, keeping
the
Correct article usage
apply
show examples
Sweden
on
Change preposition
in
show examples
second
Add an article
the second
show examples
rank and
United
Correct article usage
the United
show examples
States
on
Change preposition
in
show examples
third
.
Submitted by shyamamw146 on

Unauthorized use and/or duplication of this material without express and written permission from this site’s author and/or owner is strictly prohibited. Excerpts and links may be used, provided that full and clear credit is given to Writing9 with appropriate and specific direction to the original content.

Sentences: Add more complex sentences.
Basic structure: Write more paragraphs.
Basic structure: Add more body paragraphs.
Common mistake: Your writing should be 150-250 words.
Basic structure: Write more paragraphs.
Vocabulary: The word "graph" was used 2 times.
Vocabulary: The word "compared" was used 2 times.
What to do next:
Look at other essays: