
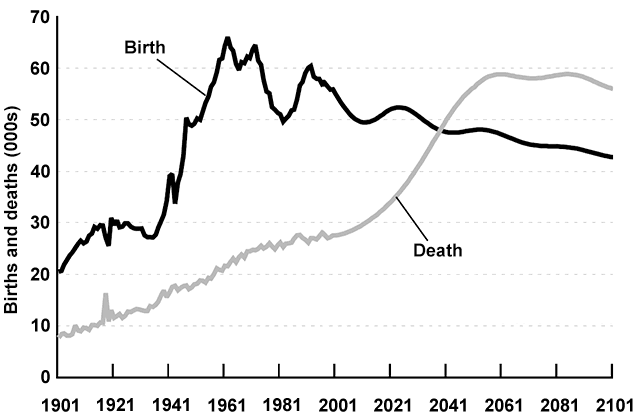
The graph illustrated the
rate
of Use synonyms
birth
and Use synonyms
death
conversion in New Zealand for over 100 years and foresees that until 2101.
Use synonyms
Overall
, the Linking Words
birth
Use synonyms
rate
was higher than the Use synonyms
death
Use synonyms
rate
at the beginning. Both curves experienced an upward trend and there had some significant rise until the present day. Use synonyms
Afterward
, the Change the spelling
Afterwards
death
Use synonyms
rate
will be increased sharply and exceeded the Use synonyms
birth
Use synonyms
rate
Use synonyms
at the end
of the prediction.
In 1901, the starting point of Linking Words
Use synonyms
birth
Correct article usage
the birth
rate
was nearly 20000 and remained steady growth until 1941. Between 1941-1961 it experienced a rapid surge to more than a triple, approximately Use synonyms
by
65000 and hit the highest point over the period. There was some fluctuation in the following 20 years.
In comparison, the amount of Change preposition
apply
death
Use synonyms
was
dramatically rose from 2001 to 2061 and outweighs the amount of Unnecessary verb
apply
birth
in 2041, almost 50000. It estimated a gradual Use synonyms
extend
to about 60000 at Replace the word
extension
last
.Linking Words