
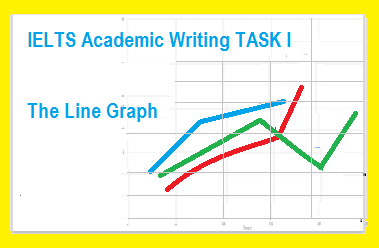
The line graph gives data about
harvesting
of Add an article
the harvesting
potato
in three different countries as : New South Wales, Fix the agreement mistake
potatoes
Victoria
, and Queensland during the five-year period from 2005 to 2010.
Use synonyms
Overall
, showing Linking Words
downward
trend Correct article usage
a downward
Victoria
was Use synonyms
dominant
country at the beginning of the given period. Meanwhile, Queensland which had average Add an article
a dominant
the dominant
tonnes
of yield take a lead in five years.
Use synonyms
Look
at the details we can see that harvest of New South Wales which showed the lowest point in 2005, before falling steadily to just over 10 Wrong verb form
Looking
million
Use synonyms
tonnes
in 2010, Use synonyms
increased
slightly to just above 20 Wrong verb form
increasing
million
in 2006 . Going down in 1 year by about 4 Use synonyms
million
Use synonyms
tonnes
Use synonyms
Victoria
's harvesting boomed to 40 Use synonyms
million
Use synonyms
tonnes
. By the end of the period Use synonyms
yield
of Correct article usage
the yield
Victoria
went up by 10 Use synonyms
million
Use synonyms
tonnes
of potato.
Use synonyms
By contrast
, Queensland's harvesting rose to nearly 30 Linking Words
million
Use synonyms
tonnes
in 2010 , after Use synonyms
slight
reduction to well under 20 Correct article usage
a slight
million
in 2006.Use synonyms