
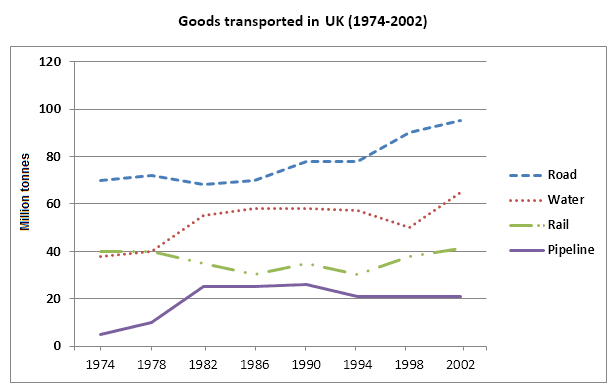
The amount of
goods
transported by four separate modes of transport, namely road, Use synonyms
water
, rail and Use synonyms
pipeline
in the UK over a 28-year period from 1974 to 2002 is shown in the line graph, measured in Use synonyms
million
stones.
Use synonyms
Overall
, the highest amount of Linking Words
goods
Use synonyms
was
transported via roadway Change the verb form
were
whereas
Linking Words
pipeline
remained the least commonly used mode of shipping over the entire period. Use synonyms
Although
there were some fluctuations, transport by road, Linking Words
water
and Use synonyms
pipeline
showed an upward trend Use synonyms
while
/Linking Words
whereas
transportation via rail reduced for a Linking Words
while
before returning to the same levels. In 1974, around 70 Linking Words
million
Use synonyms
tonnes
of Use synonyms
goods
were transported by road and Use synonyms
this
quantity rose to about 100 Linking Words
million
Use synonyms
tonnes
towards the end of the span.
Use synonyms
Use synonyms
Pipeline
transported 5 Correct article usage
The pipeline
million
Use synonyms
tonnes
of Use synonyms
goods
in 1974. Use synonyms
This
figure increased steadily over the years and in 2002, about 20 Linking Words
million
Use synonyms
tonnes
of Use synonyms
goods
were transported using Use synonyms
this
means. Both Linking Words
water
and railways transported about 40 Use synonyms
much
Correct quantifier usage
apply
tonnes
of Use synonyms
goods
in 1974 and that capacity remained more or less the same over the Use synonyms
next
four years. Afterwards, transport by Linking Words
Use synonyms
water ways
rose, Correct your spelling
waterways
whereas
transportation by railways declined. During the period from 1986 to 1994, waterways transported around 60 Linking Words
million
Use synonyms
tonnes
of Use synonyms
goods
. Use synonyms
This
quantity declined to around 50 Linking Words
million
Use synonyms
tonnes
in 1998 and rose to about 65 Use synonyms
million
Use synonyms
tonnes
over the Use synonyms
next
four years.
Linking Words
By contrast
, Linking Words
quantity
of transportation by rail declined to 30 Add an article
the quantity
a quantity
million
Use synonyms
tonnes
in 1984 and showed fluctuations until 1998 before rising again to 40 Use synonyms
million
Use synonyms
tonnes
in 2002.Use synonyms