
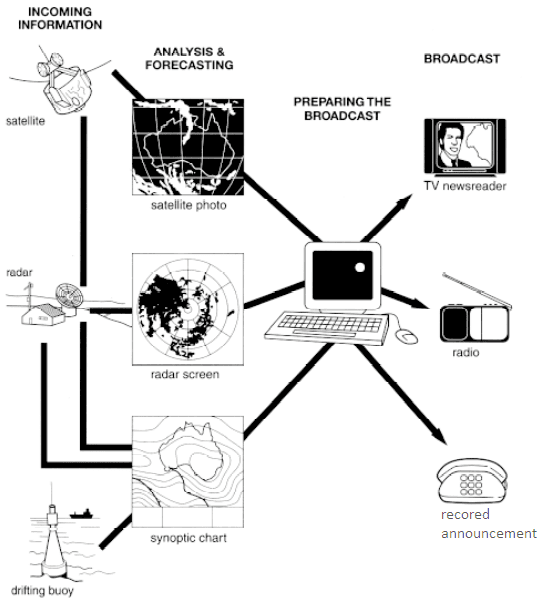
The illustration provides information about the process of collecting current and reliable
weather
forecasts and Use synonyms
then
broadcasting Linking Words
this
to mass people which are conducted by the Australian Bureau of Meteorology.
As can be seen, Linking Words
this
process needs some equipment to gather news forecasts and three main sources, Linking Words
such
as satellite, radar, and the drifting buoy Linking Words
is
used for collecting Unnecessary verb
apply
weather
information.
Use synonyms
To begin
with, the satellite is used to capture images of Australian Linking Words
weather
from the outside of the planet. Meanwhile, radar can give screen pictures Use synonyms
while
a drifting buoy Linking Words
which
is placed on the sea Correct pronoun usage
apply
reveals
a synoptic chart of the Australian climate.
Wrong verb form
revealing
Subsequently
, all of the information is analysed to know the real Linking Words
weather
condition in Australia. After that, these data are put on the computer to prepare the report for the public broadcast. People will know the Use synonyms
weather
forecasts in Australia through various media, Use synonyms
in particular
, TV Linking Words
newsreader
, radio, and recorded announcementFix the agreement mistake
newsreaders