
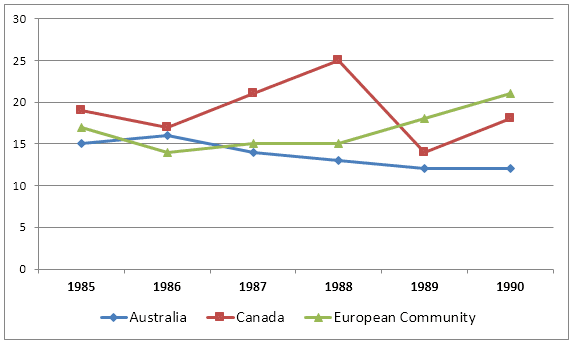
The line graph compares information on the amount of wheat exported in 3 regions
From 1985 to 1990. Units are measured in millions of
tonnes
.
To summarize, it is clearly seen that Canada and European Community witnessed an upward trend. Use synonyms
In contrast
, there was a noticeable decrease in Linking Words
Australia
's cereal export over a 5-year period.
Turning into details, in 1985 there was a slight difference in the amount of grass which was exported from Canada and Use synonyms
European
Community, accounting for 19 and 17 thousand Correct article usage
the European
tonnes
respectively. Between 1986 and 1988, Canada showed a significant rise Use synonyms
regarding
exported wheat and hit its peak point of 25 before Change preposition
in
dramatic
decrease to 14 in the following year. Correct article usage
a dramatic
In contrast
, at that time European Community began to send much more grass abroad and reached approximately 18 trillion Linking Words
of
Change preposition
apply
tonnes
in 1989. Use synonyms
On the other hand
, in 1985 the figure Linking Words
of
exported wheat in Change preposition
for
Australia
was the lowest (15 million Use synonyms
tonnes
) among these three regions. Despite a small growth Use synonyms
by
2 million Change preposition
of
tones
to 17 from 1985 to 1986, Correct your spelling
tonnes
Australia
followed a downward trend till 1989. Commencing from 1989 to 1990, the proportion of cereal exported from Use synonyms
Australia
Use synonyms
leveled
out at 11, Change the spelling
levelled
while
other regions showed an increasing pattern.Linking Words