
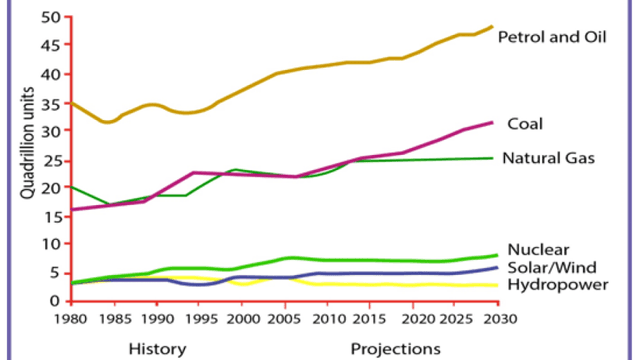
The line graph illustrates the amount of energy consumed by Americans in six different kinds categories of fuels between 1980 and 2030.
In general, the vast majority of energy used in the USA is petrol and oil,
while
the consumptions of nuclear, solar/windLinking Words
,
and Remove the comma
apply
hydro power
always remain at the lowest levels.
In 1980, people in the USA consumed about 35 Correct your spelling
hydropower
quadrillion
Use synonyms
units
of petrol and oil. In the same year, around 20 Use synonyms
quadrillion
Use synonyms
units
of coal and 17 Use synonyms
quadrillion
Use synonyms
units
of natural gas were used. Meanwhile, the figures for nuclear, solar/wind and Use synonyms
hydro power
were exactly the same in 1980, about 4 Correct your spelling
hydropower
quadrillion
Use synonyms
units
.
During the whole period shown, the consumption of petrol and oil, coal, and natural gas Use synonyms
witness
a slight increase and is projected to peak at about 48, 30, and 25 Wrong verb form
witnessed
quadrillion
Use synonyms
units
respectively in 2030. During Use synonyms
this
period, the amount of nuclear, solar/wind and Linking Words
hydro power
used stays relatively unchanged at approximately 5 Correct your spelling
hydropower
quadrillion
Use synonyms
units
.Use synonyms