The charts below show the results of a questionnaire that asked visitors to the Parkway Hotel how they rated the hotel's customer service. The same questionnaire was given to 100 guests in the years 2005 and 2010. Summarise the information by selecting and reporting the main features and make comparisons where relevant. You should write at least 150 words.

#show #results #questionnaire #visitors #parkway #hotel #customer #service #guests #years #summarise #information #features #comparisons
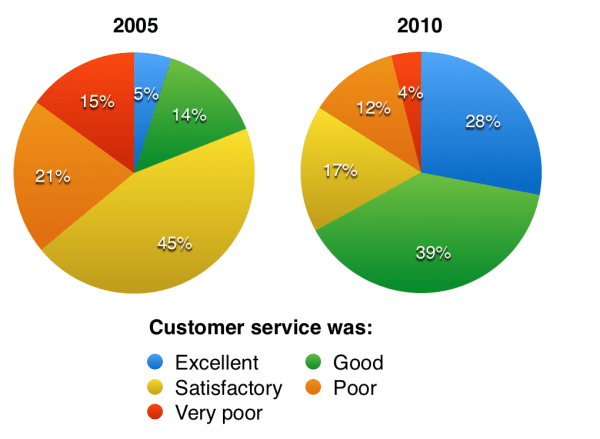
The given pie graph depicts the information collected from the customers of
a
Parkway Hotel in the years 2005 and 2010. The graph is presenting the data related to the satisfaction level of the guests of a particular motel.
As shown in the pie chart the Correct article usage
apply
overall
customer work of the tavern has improved and the number of visitors who were poorly satisfied has declined.
First and foremost in 2005, there were only 19% of people liked the duty and this
figure rose to 67% by the year 2010. Moreover
, guests who said the customer work was satisfactory fell down
from 45% to 17% in the year 2010.
Change preposition
apply
In addition
to
the number of unsatisfied customers had dramatically declined to 4% in the year 2010 and it was 15% in 2005. Change preposition
apply
Furthermore
, 21% of resort customers fill in the report that the hotel service was very poor, this
figure cut
down almost to half in 2010.Add a missing verb
was cut
Submitted by kandholamanpreet on
Unauthorized use and/or duplication of this material without express and written permission from this site’s author and/or owner is strictly prohibited. Excerpts and links may be used, provided that full and clear credit is given to Writing9 with appropriate and specific direction to the original content.
Sentences: Add more complex sentences.
▼
Vocabulary: Rephrase the word "information" in your introduction.
▼
Vocabulary: The word "graph" was used 2 times.
▼
Vocabulary: The word "figure" was used 2 times.
▼
Vocabulary: The word "number of" was used 2 times.
▼
Vocabulary: The word "declined" was used 2 times.
▼