
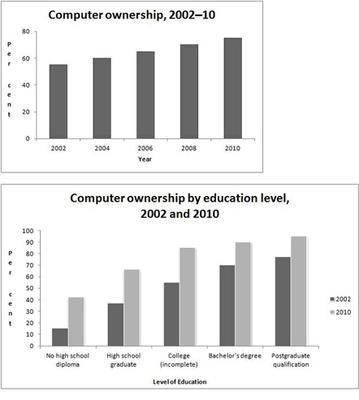
The bar graph compares the
percentage
of Use synonyms
a
population that owns a Correct article usage
the
computer
from the Use synonyms
year
2002 and 2010, and by six educational levels for the years 2002 and 2010.
Fix the agreement mistake
years
Overall
, Linking Words
computer
Use synonyms
ownership
steadily grew over the given period. Use synonyms
Similarly
, a significant Linking Words
increased
can be seen in all Replace the word
increase
level
of education, Fix the agreement mistake
levels
although
it can be observed that Linking Words
higher
level of education corresponds to Correct article usage
a higher
higher
Add an article
a higher
the higher
percentage
of Use synonyms
ownership
in both years.
In 2002, roughly 58% of the population owned a Use synonyms
computer
. The Use synonyms
percentage
rose to approximately 5% every 2 years reaching 75% in 2010.
Use synonyms
On the other hand
, in 2002, there was a higher Linking Words
percentage
of Use synonyms
ownership
in Use synonyms
people
who finished High Use synonyms
school
compared to Use synonyms
people
without Use synonyms
High
Correct article usage
a High
school
Use synonyms
diploma
, 45% and 15% respectively. By 2010, the Fix the agreement mistake
diplomas
percentage
of Use synonyms
people
without Use synonyms
High
Correct article usage
a High
school
Use synonyms
diploma
nearly tripled, Fix the agreement mistake
diplomas
while
Linking Words
people
who finish High Use synonyms
school
Use synonyms
has
doubled. Correct subject-verb agreement
have
In contrast
, half of Linking Words
college
undergraduates in 2002 had a Add an article
the college
computer
. Use synonyms
However
, it dramatically rose to 85% in 2010. Linking Words
People
with bachelor’s Use synonyms
degree
and Fix the agreement mistake
degrees
post graduates
proved to have the greatest Correct your spelling
postgraduates
percentage
of Use synonyms
ownership
both in 2002 and 2010, 80% and 90% respectively, 10% higher than Use synonyms
2002
.
During the Change preposition
in 2002
8 year
Add a hyphen
8-year
period
a substantial growth Add a comma
,period
of
Change preposition
in
computer
Use synonyms
ownership
can be seen in the population and by educational level.Use synonyms