
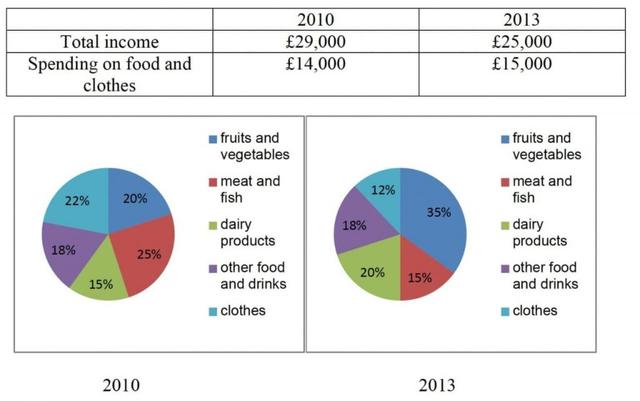
The charts give information regarding the average expenditure
was
used on a range of products Unnecessary verb
apply
as well as
the percentage of items related to Linking Words
nutrient
and garment Fix the agreement mistake
nutrients
were
consumed by residentsUnnecessary verb
apply
a
period of 3 years.
From a general perspective, the total income had a downward trend Change preposition
over a
while
the population consume a range of items increased from 2010 to 2013. Linking Words
Moreover
, the proportion of Linking Words
costume
had the highest Fix the agreement mistake
costumes
rate
Use synonyms
in
consumption.
Looking at the first chart, it is immediately obvious that Change preposition
of
a
sum of expenditure reached Correct article usage
the
at
29,000 before dropping to 25,000. Change preposition
apply
However
, the number of both nutrients and clothes slightly rose by 1000 over the Linking Words
next
3 years.
We can be seen that the percentage of meat and fish was the highest Linking Words
rate
in Use synonyms
household’s
consumption. Change noun form
household
However
, there Linking Words
is
was a significant decrease from 25% to 15% between 2010 to 2013. Unnecessary verb
apply
Next
, both Linking Words
dairy
product Correct article usage
the dairy
Use synonyms
rate
Fix the agreement mistake
rates
along with
vegetarian food Linking Words
Use synonyms
rate
dramatically rose from 15% to 20% and 20% to 35% , respectively. The item with the highest percentage of consumption Fix the agreement mistake
rates
was clothes
in 2013. There was a sharp fall of 10% in Change the verb form
was clothed
was clothing
vegetarian
Correct article usage
the vegetarian
rate
. Use synonyms
Finally
, the number of consumers Linking Words
used
other food and drinks Correct pronoun usage
who used
which
remained stable after 3 years.Correct pronoun usage
apply