
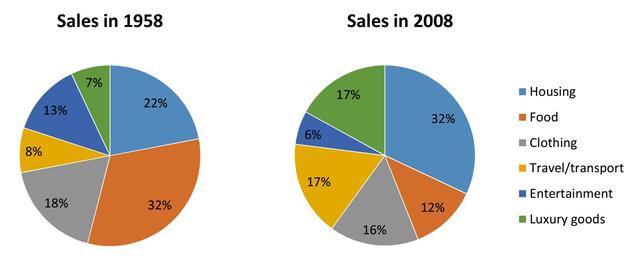
The given pie charts compare the expenditure of European citizens on five different goods over a two-year period.
Overall
, it is noticeable that housed appliances, luxurious products, and food occupied an upward trend. Linking Words
However
, an opposite trend is observed in clothes and transportation, which experienced a decline in consumed numbers. Interestingly, the percentage of clothing is comparable to those of housing in different yearsLinking Words
upon
.
Focusing on, housing, lavish, and clothing consumption, the figure in clothing was one-tenth higher than housing expended (22%) in 1958. Change preposition
apply
However
, the housing expended overtook those of clothing, which dramatically dropped to 12%. Linking Words
In addition
, Linking Words
the
luxurious products significantly grew from 7% to 17% in 2008.
Turning to the remaining amenities, in 2009, the figures for entertainment, food, Correct article usage
apply
transported
goods were 18%, 8% ,Correct word choice
and transported
13
%, respectively. Correct word choice
and 13
While
the proportion of food paid witnessed an increasing trend, there was a substantial lessening of others. To be more precise, the Linking Words
Correct quantifier usage
number of food’s
food’s
number roseChange noun form
food
9
% to Change preposition
from 9
be
17%, Unnecessary verb
apply
whereas
the 2%,Linking Words
7
% of travelling and entertaining products dropped respectively in 2008.Correct word choice
and 7