
he
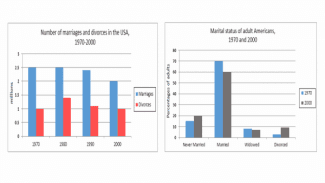
first chart illustrates the change in the number of marriages and divorces in the US over a 30-year period from 1970. The Correct your spelling
The
second
chart compares the proportion of American Linking Words
adults’
Change noun form
adults
different
marital statuses in two years, 1970 and 2000.
Change preposition
with different
Overall
, there was a clear downward trend of Linking Words
people
getting married in the US. Use synonyms
Although
a majority of adult Americans were married in both recorded years, there was a quite higher percentage of Linking Words
people
staying single in 2000.
From 1970 to 1980, 2.5 Use synonyms
million
marriages were registered in America; Use synonyms
however
, Linking Words
this
number gradually decreased to 2 Linking Words
million
by the year 2000. Use synonyms
In contrast
, the number of divorces filed was around 1 Linking Words
million
in 1970 and Use synonyms
then
reached a peak at almost 1.5 Linking Words
million
a decade later. There had been since Use synonyms
then
fewer divorces and the figure fell back to 1 Linking Words
million
in 2000, exactly 50% of that of the marriages in the same year.
The percentage of married American adults dropped from 70% in 1970 to around 60% in 2000. Use synonyms
Similarly
, there was a marginal decrease in the proportion of widowed Linking Words
people
. The figures for never-married Use synonyms
people
and divorced ones experienced a slight rise, by around 8% for each category.Use synonyms