
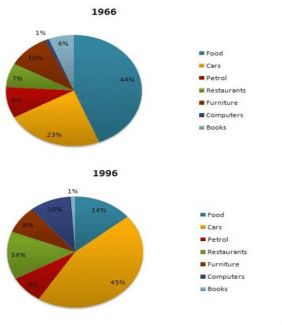
The pie charts displace changes in UK spending patterns from 1996 to 1996.
Food and cars made up the two main items of Expenditure in both Years. Both comprised over 50% of household spending.
Food accounted for 44% of spending in 1966, but
this
shrank by Linking Words
two thirds
to 14% in 1996. Add a hyphen
two-thirds
Nevertheless
, expenditures on cars doubled increasing from 23 % in 1966 to 45% in 1996. Linking Words
While
spending on restaurants Linking Words
also
grew twofold climbing from 7 % to 14%, the proportion of salary spent on computers increased dramatically up from 1 % in 1996 to 10% in 1996. Linking Words
However
, off on books plummeted from 6 % to 1% respectively.
Some areas remained relatively unchanged Britons spent approximately the same amount of salary on petrol and furniture in both years.
Linking Words
Overall
there was a relatively high increase in the amount spent on cars, computers and restaurants at the expense of food and books.Linking Words