
These two diagrams
show
Use synonyms
happiness
ratings between two Use synonyms
groups
of single and married Use synonyms
people
. Use synonyms
Linking Words
Also
they Add a comma
Also,
show
the difference between Use synonyms
couples
with Use synonyms
children
and without them. Use synonyms
This
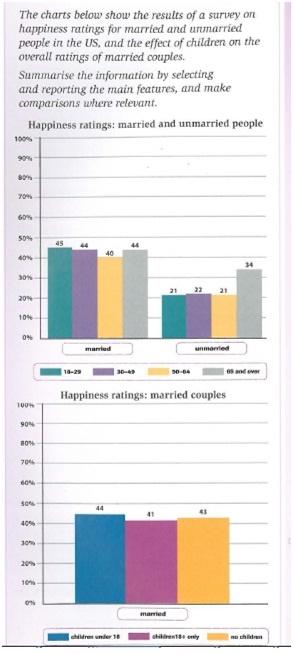
survey was done in the US. Conforming to the first diagram, 4 age Linking Words
groups
of Use synonyms
people
who are married are happier than single ones.The Use synonyms
happiness
level among married Use synonyms
people
varies between 40 and 45 Use synonyms
Use synonyms
percent
. Change the spelling
per cent
People
who are in the 18 - 29, 30-49 and 65 and over years old Use synonyms
groups
have had the biggest percentage of Use synonyms
happiness
. At the same time, three Use synonyms
groups
of single Use synonyms
people
Use synonyms
show
lower percentage rates which are between 21 and 22, but the group of Use synonyms
people
that are 65 years old and over unmarried have big differences and their Use synonyms
happiness
rate is about 34 Use synonyms
percent
. Use synonyms
In addition
, Linking Words
couples
who are married and have Use synonyms
children
younger than 18 years old are happier than the other 2 Use synonyms
groups
with 18+ Use synonyms
children
and with no Use synonyms
children
. Use synonyms
Couples
with Use synonyms
children
under 18 have Use synonyms
44
Correct article usage
a 44
Use synonyms
percent
Change the spelling
per cent
happiness
rating, with 18+ only 41 Use synonyms
Use synonyms
percent
and with no Change the spelling
per cent
children
43Use synonyms
Change the spelling
per cent
percent
. Use synonyms
All over
, these diagrams Rephrase
Overall
show
that the Use synonyms
happiness
rate among married Use synonyms
couples
is higher than Use synonyms
unmarried
Change preposition
among unmarried
couples
.Use synonyms