
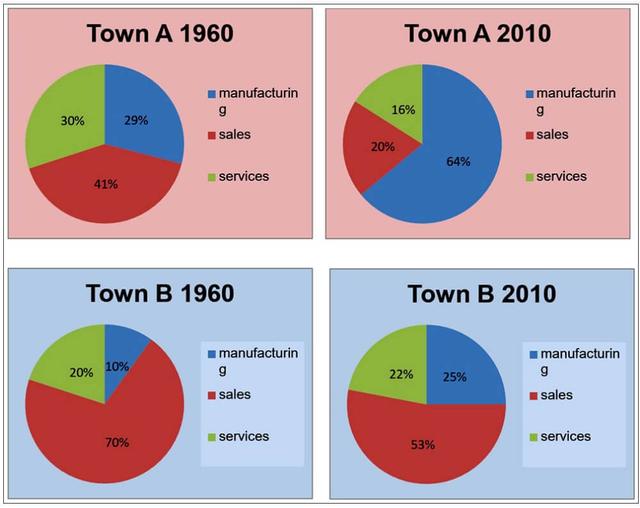
The pie chart compares the workforce being employed in different fields : manufacturing,
sales
, and services in Use synonyms
city
A and B in 1960 and 2010.
Fix the agreement mistake
cities
Overall
, it can be clearly observed that the proportion of workers in Linking Words
Use synonyms
sales
sector which was the largest one in 1960 was substituted by that of employees in manufacturing in 2010 in Correct article usage
the sales
town
A, Use synonyms
whereas
people working in Linking Words
sales
remained the most significant field in 2010 in Use synonyms
town
B.
Use synonyms
Staring
in 1960 in Correct your spelling
Starting
town
A, at 41 % , Use synonyms
sales
was the biggest working sector, followed by services and manufacturing at 30% and 29%,respectively.Use synonyms
However
, manufacturing replaced Linking Words
sales
as the primary working field which accounted for 60% in 2010, Use synonyms
whereas
Linking Words
sales
and services dropped by 21% and 14% to 20 and 16%, respectively in the same year.
With regard to Use synonyms
town
A, Use synonyms
although
the proportion of Linking Words
sales
dropped moderately from 70% to 53%, it remained the biggest sector of Use synonyms
working
. Replace the word
work
In contrast
, Linking Words
manufacturing
ratio in 1960 was over two times higher than that in 2010.Add an article
the manufacturing