
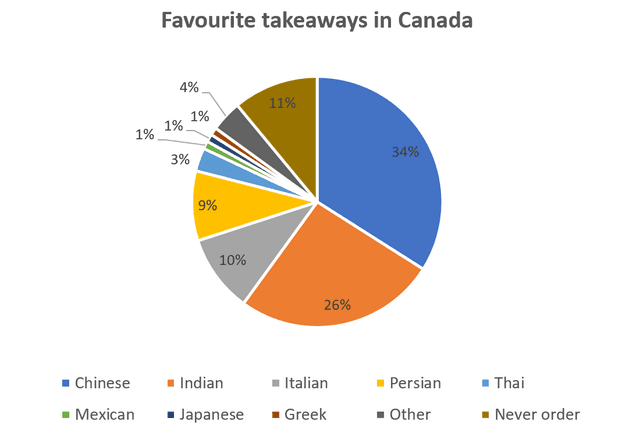
The pie chart illustrates the percentage of the most popular
takeaways
food types that are purchased by Canadians, Change the noun form
takeaway
while
the bar graph presents how many Linking Words
Indian
restaurants operated in Canada from 1960 to 2015.
It can clearly be seen that the sector of Chinese and Use synonyms
Indian
contribute the most vital key to take-home foods. Use synonyms
Furthermore
, the number of Linking Words
Indian
restaurants in Canada rose steadily during Use synonyms
this
period.
The pie chart shows that the Chinese and Linking Words
Indian
types that are brought by citizens are much more widespread than all the others, at 34% and 26%. There is Use synonyms
the
number of people who have never ordered more than one-tenth at 11 %. Correct article usage
a
While
Greek, Japanese and Mexican are only chosen by 1% of people.
In Linking Words
a
detail of the Correct article usage
apply
second
graph, at the beginning of the period started under 2000 restaurants. Linking Words
Next
, the graph surged sharply until 2007 and reached a peak point in 2009 with approximately 9000. After that, the number remained stable until 2015.Linking Words