
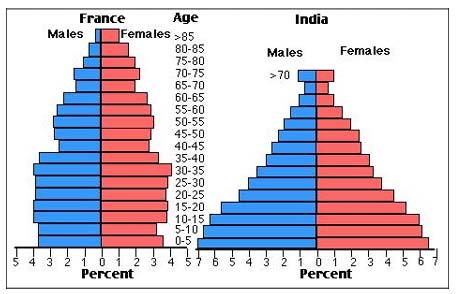
The given chart indicates how different the
age
structure is in terms of the population in two nations, France and India in 1984.
Use synonyms
Overall
, in both countries, the population decreased as people got older.
In detail, in France, people who are between the ages of 0 and 40 accounted for 3 to over 4 per cent of the population of both sex, Linking Words
while
the public who are from the Linking Words
age
of 40 to 65 stood at 2.5 to 3 per cent. Use synonyms
Moreover
, the proportion of them between 56 and 85 occupied just over 0 to less than 2.
In India, people between the Linking Words
age
of 0 and 5 took up close to 7 per cent and it is the largest rate of all rates. the public between 5 and 25 comprised 4 to 7, as they get older than before. The percentage of them Use synonyms
25
Change preposition
from 25
to70
had a steady drop from 4 to 1, Correct your spelling
to 70
whereas
increased at the Linking Words
age
of over 70.Use synonyms