
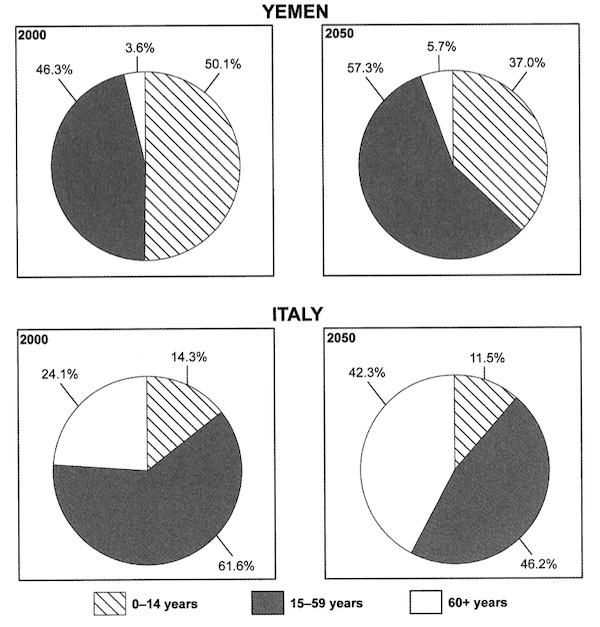
The research above outlines the distribution of
population
age Use synonyms
groups
in Italy and Yemen in the year Use synonyms
of
2000 Change preposition
apply
as well as
a prediction Linking Words
how
the situation will change by 2050. Change preposition
of how
Researches
divide the Correct your spelling
Researchers
population
Use synonyms
in
3 Change the preposition
into
groups
: 0-14 years old(hereafter y.o.), 15-59 y.o., 60+ y.o. The shares or age Use synonyms
groups
vary a lot between the countries in the Use synonyms
study
and there are no obvious similarities, so let me walk you Use synonyms
through
.
At the beginning of Correct pronoun usage
themthrough
Use synonyms
Add an article
the study
study
there is almost a parity between Add a comma
,study
age
Correct article usage
the age
groups
of 15-59 y.o. gnd 0-14 y.o. (46.3% and 50.1% respectively) and it changes with a drop to 37.0% for the latter group by 2050. The 60+ y.o. group is expected to steadily grow Use synonyms
by
from 3.6% to 5.7% over the 50 years period of Change preposition
apply
study
.
Italy starts the Use synonyms
study
with Use synonyms
14.3
% share of 0-14 y.o., 61.6% of 15-59 y.o. and 24.1% of 60+ y.o. The research outlines a prediction that Correct article usage
a 14.3
Use synonyms
population
of Ityle will get older by 2050 and end up with over 40% of Correct article usage
the population
Use synonyms
population
being 60+ years old. At the same Add an article
the population
time
there will Add a comma
,time
also
be a little drop in the share of the younger Linking Words
population
(0-14 y.o.) to the point of 11.5%.Use synonyms