
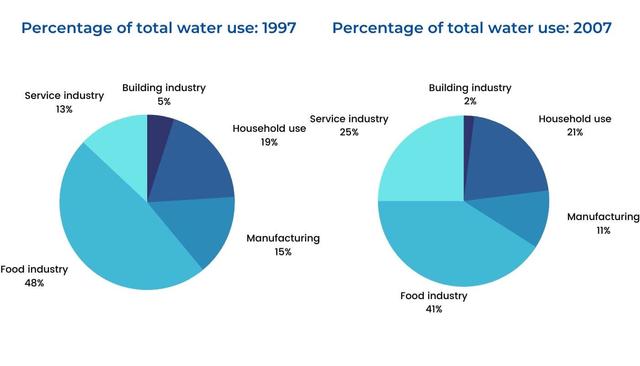
Given are two pie charts comparing the proportion of total
water
consumption divided by five sectors namely Use synonyms
Correct article usage
the servise
servise
Correct your spelling
service
services
industry
, building Use synonyms
industry
, food Use synonyms
industry
, household use and Use synonyms
manufactoring
in Sydney, Australia, in the years 1997 and 2007.
Correct your spelling
manufacturing
Overall
, Linking Words
While
the proportion of Linking Words
water
Use synonyms
usage
by Use synonyms
food
Add an article
the food
industry
, building Use synonyms
indistry
and manufacturing declined slightly, the amount of Correct your spelling
industry
water
Use synonyms
usage
by Use synonyms
Correct article usage
the servise
servise
Correct your spelling
service
industry
and household use grew during the time mentioned.
From nearly Use synonyms
a
half of the total consumption (48%) in 1997,the rate Correct article usage
apply
for
Change preposition
of
water
Use synonyms
usage
by Use synonyms
food
Correct article usage
the food
industry
Use synonyms
was
decreased by 7% in 2007. Unnecessary verb
apply
Likewise
, Linking Words
this
proportion for Linking Words
building
Correct article usage
the building
industry
saw Use synonyms
more
than Correct article usage
a more
2-times
decrease ( from 5% in 1997 to 2% in 2007). Correct your spelling
2 times
Further
, there was a minimal Linking Words
reduse
of 4% in Correct your spelling
reduce
use
the
Correct article usage
apply
water
Use synonyms
usage
by Use synonyms
manufactoring
over a period of 10 years.
With regard to the percentage of Correct your spelling
manufacturing
water
Use synonyms
usage
by Use synonyms
service
Add an article
the service
industry
, Use synonyms
this
quantity doubled approximately during the time in question (from 13% in 1997 to 25% in 2007). Linking Words
Similarly
, from less than a fifth of the total (19%) in 1997, Linking Words
this
quantity raised to 21% in 2007.Linking Words