The charts below give information about the way in which water was used in different countries in 2000. Summarise the information by selecting and reporting the main features, and make comparisons where relevant.

The charts below give information about the way in which water was used in different countries in 2000.

Summarise the information by selecting and reporting the main features, and make comparisons where relevant.
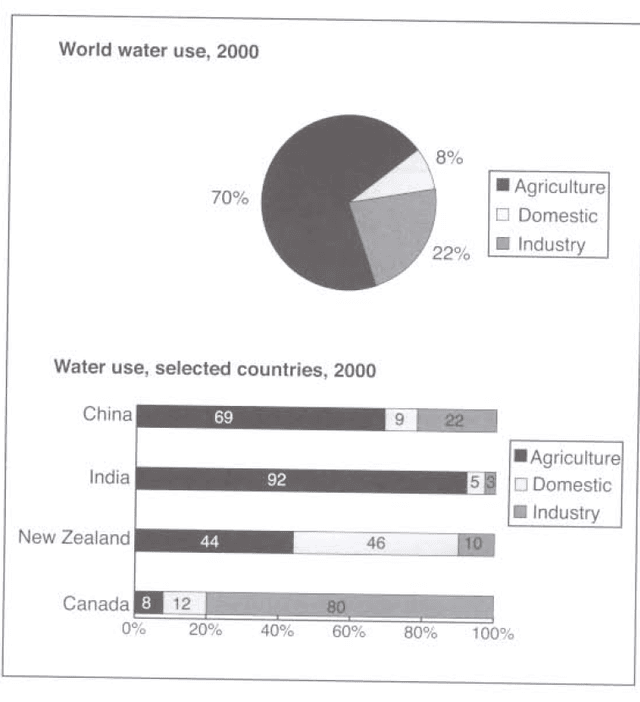
THESE TO CHARTS SHOW US THE VARIETY WAY TO CONSUME WATER IN THE WORLD AND LIKE precisely IN FOUR COUNTRIES. IT IS CLEAR FROM THE GRAPH THAT Compatibility IN STAYEL OF USED WATER.
ACCORDING TO
WHAT IS SHOWN, IN PER CHART THERE IS NO DENYING THE FACT THAT ROLE OF AgricultureIN PERCENTAGE IN THE WORLD IS 70%.
INSTEAD
,THE INDUSTRY AND DOMESTIC BECOME LIKE LOWER DEGRE AS 22%AND 8%, RESPECTIVELY. WILE, IN THE OTHER HAND WE SEE THE BIG PEAS IN INDIA,CHINA AND NEW ZEALAND GO TO Agriculture REPRESENT WAS LIKE 92%,69% AND 44%.,
OTHERWISE
THE GREATEST PER SINT IN CANADA IS INDUSTRY AT 80%.
TO SUM UP
, WE COULD SAY THERE FORE THE FEW USE THE WATER IN THE WORLD IS DOMESTIC THE range BETWEEN 5%AND 12%
Submitted by jjooojjooo2020 on

Unauthorized use and/or duplication of this material without express and written permission from this site’s author and/or owner is strictly prohibited. Excerpts and links may be used, provided that full and clear credit is given to Writing9 with appropriate and specific direction to the original content.

Common mistake: Your writing should be 150-250 words.
Basic structure: Change the fourth paragraph.
Vocabulary: Only 5 basic words for charts were used.
Vocabulary: The word "charts" was used 2 times.
Vocabulary: Use several vocabularies to present the data in the fourth paragraph.
What to do next:
Look at other essays: