
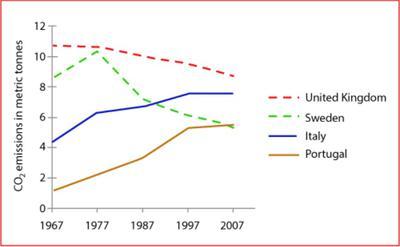
The line graph above illustrates the average carbon dioxide
emissions
per person which were discharged for 40 Use synonyms
years
between 1967 and 2007 in four different countries: United Kingdom, Use synonyms
Sweden
, Italy, and Portugal. Use synonyms
This
was measured in metric tonnes.
Linking Words
Overall
, the united kingdom had the highest total of CO2 discharge Linking Words
although
it decreased over the Linking Words
years
Use synonyms
while
Linking Words
Sweden
had reached the same statistic of Use synonyms
emissions
as the UK before it Use synonyms
finally
decreased sharply. Despite the declining Linking Words
number
of Use synonyms
emissions
in the UK and Use synonyms
Sweden
, throughout the Use synonyms
years
, Italy and Portugal had shown an increased Use synonyms
number
of carbon dioxide Use synonyms
emissions
.
The declining amount of CO2 emission in the UK was stable throughout the Use synonyms
years
with the final amount of 9 tons in 2007 but it was still the highest mass among these other 4 countries. Use synonyms
However
, Linking Words
Sweden
was fluctuating between 1967-1977 before it Use synonyms
finally
decreased in 2007.
Linking Words
On the other hand
, the incline rate of Portugal was high, approximately 4 metric tonnes until it reached the same Linking Words
number
as Use synonyms
Sweden
. Use synonyms
Likewise
, there were Linking Words
also
an increased Linking Words
number
of Use synonyms
emissions
in Use synonyms
Sweden
but not as much as in Portugal's rate.Use synonyms