
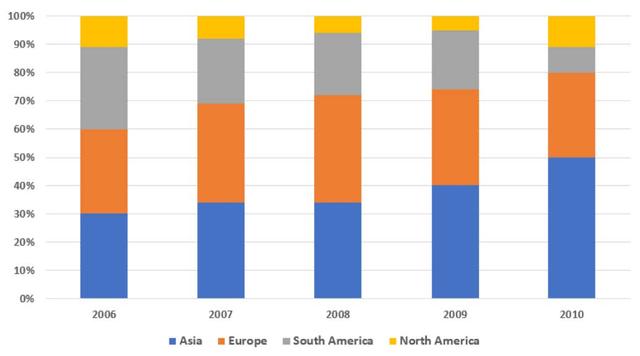
The bar chart shows the proportion of a car factory's sales in Europe, South America, Europe and Asia between the year 2006 to 2010 respectively
The bar chart illustrates the percentage of a car factory's total sale in four continents ( Asia, Europe, South America, Europe and Asia) annually during the five-year period from 2006 to 2010.
✍️ Want to check your own essay?Get started →
Unauthorized use and/or duplication of this material without express and written permission from this site's author and/or owner is strictly prohibited. Excerpts and links may be used, provided that full and clear credit is given to Writing9 with appropriate and specific direction to the original content.
Sentences: Add more complex sentences.
▼
Linking words: Add some linking words.
▼
Linking words: Add linking words.
▼
Basic structure: Write more paragraphs.
▼
Basic structure: Add more body paragraphs.
▼
Common mistake: Your writing should be 150-250 words.
Basic structure: Write more paragraphs.
▼
Vocabulary: Only 3 basic words for charts were used.
▼