
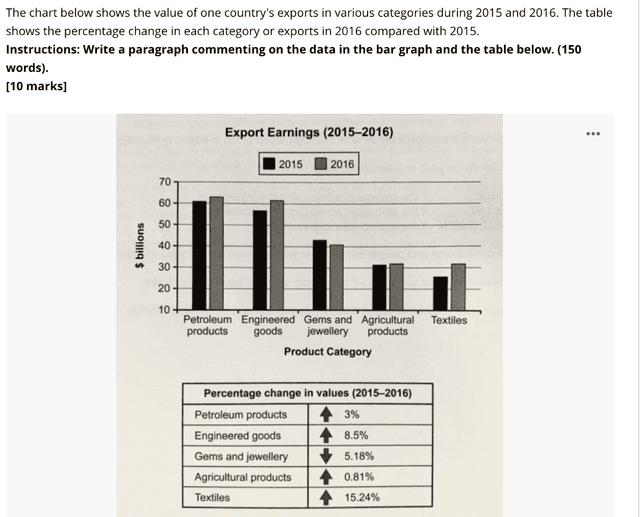
The bar chart and table illustrate the information about product categories of export earnings in comparison between 2015 and 2016. The unit amounts are given in
billion
.
Use synonyms
Overall
, it can be seen that in both 2015 and 2016, all categories Linking Words
had
rose regularly except gems and jewellery which had decreased to 5.18% from 2015 to 2016. Unnecessary verb
apply
Furthermore
, In both years, the most and least exported items were the same product, namely petroleum and Textiles respectively.
In 2015, all types of products can be seen to continually decline. The product with the highest sales was petroleum which was 60 Linking Words
billion
. Engineered goods and gems were approximately 57 and 43 Use synonyms
billion
, respectively. Use synonyms
However
, the agricultural products were half of the amounts of the largest export year or just over 30 Linking Words
billion
.
In 2016, petroleum and engineered goods had nearly value 60 - 63 Use synonyms
billion
. Following by gems and jewellery which was 40 Use synonyms
billion
. Use synonyms
finally
, the smallest values were agricultural and textiles. Anywish, textiles increased as the highest figures of 15.24% from 2015 to 2016.Linking Words