
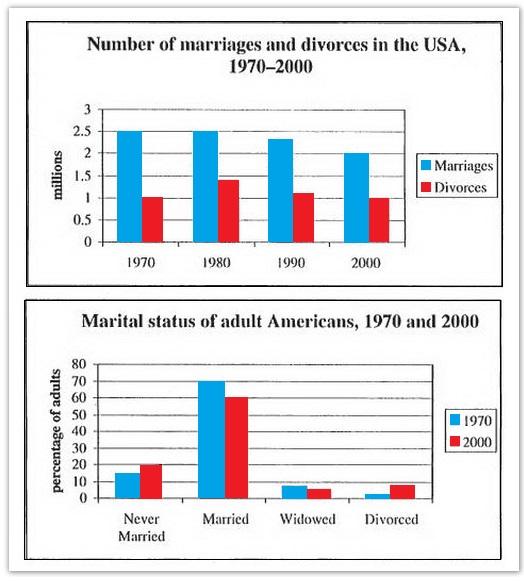
The first bar chart shows changes in the number of marriages and divorces in the USA, and the second chart shows figures for the marital status of American adults in 1970 and 2000.
It is clear that
there was a fall in the number of marriages in the USA between 1970 and 2000. The majority of adult Americans were married in both years, but the proportion of single adults was higher in 2000.
In 1970, there were 2.5 Linking Words
million
marriages in the USA and 1 Use synonyms
million
divorces. The marriage rate remained stable in 1980Use synonyms
,
but fell to 2 Remove the comma
apply
million
by the year 2000. Use synonyms
In contrast
, the divorce rate peaked in 1980, at nearly 1.5 Linking Words
million
divorces, before falling back to 1 Use synonyms
million
Use synonyms
at the end
of the period.
Around 70% of American adults were married in 1970, but Linking Words
this
figure dropped to just under 60% by 2000. At the same time, the proportion of unmarried people and divorcees rose by about 10% in total. The proportion of widowed Americans was slightly lower in 2000.Linking Words