
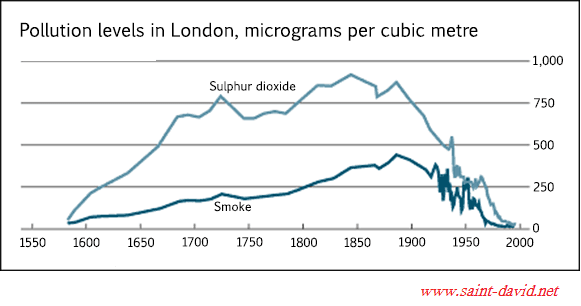
Given is a line graph which indicates the
pollution
levels in London caused by sulfur Use synonyms
dioxide
and Use synonyms
smoke
between 1600 and 2000. Use synonyms
Overall
, it is obvious that both of Linking Words
which
have rocketed yet fallen back ultimately.
Looking more closely at the data , Correct pronoun usage
these
smoke
and sulphur Use synonyms
dioxide
emerged in the late 1500s . Sulphur Use synonyms
dioxide
had increased faster than Use synonyms
smoke
, reaching over 750 micrograms per metre , meanwhile Use synonyms
smoke
rose smoothly to approximately 250 micrograms per metre in 1725 .
Yet Sulphur Use synonyms
dioxide
, Use synonyms
as well as
Linking Words
Use synonyms
smoke
dropped a bit after 1725 , it didn't Add the comma(s)
,smoke
effect
a lot since they soon climbed back in the next 1800s. Both of the mentioned Correct your spelling
affect
Use synonyms
pollution
peaked in 1850 with figures of 900 and 400 respectively .
Change to a plural noun
pollutions
Finally
, the number of Linking Words
pollution
fluctuated after the highest point and had dramatic changes in the middle of the 1900s . Soon reaching the lowest levels of Use synonyms
pollution
in the late 1900s.Use synonyms