
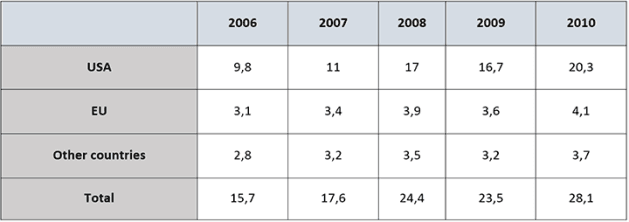
the table compares the quantity of money the USA,
EU
Use synonyms
countries
and other nations donated to developing Use synonyms
countries
between 2006 and 2010.
Use synonyms
overall
, it can be seen clearly that the spending of the USA on other Linking Words
countries
was far higher than Use synonyms
EU
and others. remarkably, all figures enjoyed a steady upswing throughout the surveyed period.
in 2006, the US expenditure on developing Use synonyms
countries
hit its peak of $9.8 Use synonyms
million
, followed by the figure for Use synonyms
EU
nations. 2 years later, Use synonyms
while
the donation of Linking Words
EU
Use synonyms
countries
just increased by $ 0.8 Use synonyms
million
to $ 3.9 Use synonyms
million
, the US spending grew to $17 Use synonyms
million
. until the end of the period, $4,1 Use synonyms
million
was given to other poor Use synonyms
countries
by the Use synonyms
EU
. meanwhile, the amount of money spent on donations in the US followed a significant growth, accounting for $20.3 Use synonyms
million
in 2010.
Use synonyms
in addition
, other Linking Words
countries
' expenditures increased minimally throughout the 4 year period, Use synonyms
this
category grew by only $0.9 Linking Words
million
to $ 3.7 Use synonyms
million
in 2010. the same pattern was recorded in the total spending, Use synonyms
this
figure rose continually until 2008, Linking Words
then
dropped to $ 23,5 Linking Words
million
before soaring in 2010.Use synonyms