
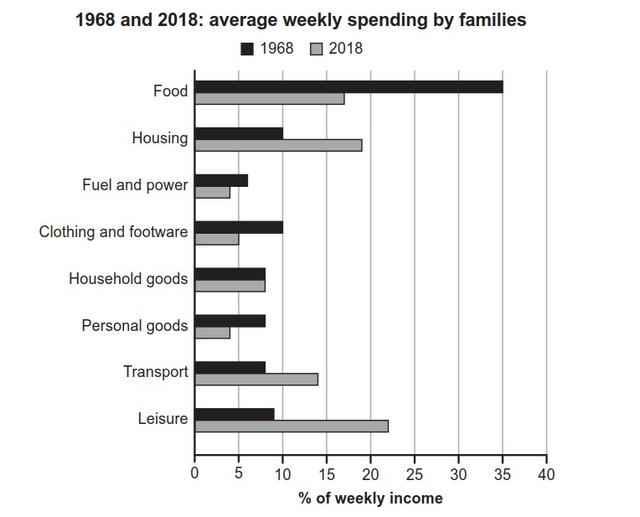
The chart provides information about family expenses in the years 1968 and 2018 in one specific country. The data is given in percentage per weekly income. Assessment has been done on eight different aspects.
Overall
, most expenses have fallen since 1968, except for housing, transport, and Linking Words
leisure
which have increased in 2018. Meanwhile, money spent on household Use synonyms
goods
remained unchanged.
In 1968, people had the highest rate of cost (about 35%) for food, Use synonyms
while
household Linking Words
goods
, personal Use synonyms
goods
, and transport were the lowest and almost the same, about 8% of weekly hatches. Fuel and power were the least expensive, taking only 6% of the income. Both clothing and Use synonyms
leisure
indicate roughly similar figures, as 9-10%.
Turning to 2018, the most significant changes were seen in Use synonyms
leisure
, housing, and food expenses. Money spent on food, showed a dramatic fall, as there is a sharp increase in Use synonyms
leisure
costs. Housing and transport figures saw a considerable jump, reaching about 20% and 15% respectively. Fuel, clothing, and personal Use synonyms
goods
charges fell slightly, reaching about 5% of weekly earnings.Use synonyms