
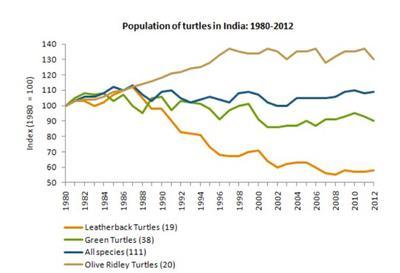
The line graph depicts the
population
of several turtle Use synonyms
species
in India from 1980 to 2012. Despite the fact that just a few hundred Use synonyms
turtles
remained in India.
In general, all turtle Use synonyms
species
were at 100 in 1980, but by 2012, Olive Ridley Use synonyms
turtles
had increased their numbers and remained at the top. Leatherback Use synonyms
turtles
, Use synonyms
on the other hand
, came in Linking Words
last
.
That was evident to me; the number of progeny of leatherback Linking Words
turtles
grew starting in 1980 and stayed at 135 by 1997. After Use synonyms
then
, it managed to stay around 125 through several ups and downs until 2012. Green Linking Words
turtles
have been facing Use synonyms
population
declines since the early 1980s. Use synonyms
Furthermore
, their Linking Words
population
fluctuated and stayed at 85 in 2012. Use synonyms
Furthermore
, leatherback Linking Words
turtles
were going extinct at a quicker rate than other Use synonyms
species
; their number started to drop one by one and had reached 19 by 2012.
Use synonyms
Finally
, the surviving Linking Words
species
were able to consistently regulate their Use synonyms
population
, with occasional ups and downs from the 1980s until 2012.Use synonyms