
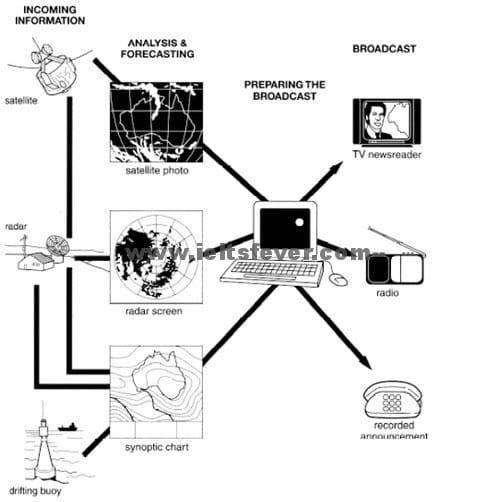
The given figure illustrates the process of collecting
information
on the weather to make a comprehensive forecast conducted by the Australian Meteorology Bureau in one minute. The diagram starts with incoming Use synonyms
information
and informs the Use synonyms
data
results as the Use synonyms
last
step.
Linking Words
To begin
with, there are three facilities to collect wheater Linking Words
data
; satellite, radar and drifting buoy. Scientists analyze and forecast the Use synonyms
information
taken from a satellite in space Use synonyms
as well as
the Linking Words
data
coming from the radar shows a radar screen which provides weather conditions Use synonyms
in particular
areas of the world. Linking Words
In addition
, the bureau collects up-to-the-minute synoptic charts from a drafting buoy which is located in the sea. After all the Linking Words
information
is complete, The Use synonyms
data
is inputted into a computer to prepare the broadcast and Use synonyms
subsequently
, reliable forecasts are published in many media, including TV newsreaders, radio, and recorded Linking Words
information
.
In conclusion, What the bureau do is that people can know the weather condition Use synonyms
such
as rain, snow, temperature, etc from a believable institution.Linking Words