
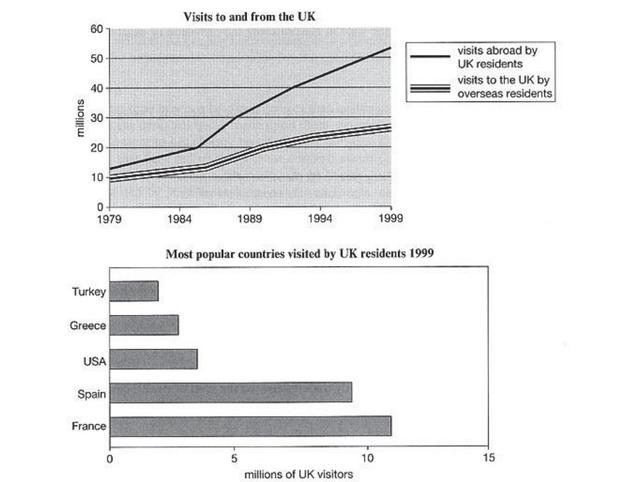
The line graph demonstrates the number of UK inhabitants going abroad and overseas homeowners visiting the United Kingdom during the year 1979-1999,
whereas
, the bar graph depicts how many UK residents travelled to the five most well-known countries in 1999. Units are measured in millions of people
Linking Words
Overall
, the total percentage of visitors travelling trend soared significantly throughout all years, whilst a vast majority of London tourists travelling to Spain and France and other national interests were least popular. Units are measured in millions of people
Looking into the line chart, in the commencing year (1979), the number of UK citizens preferred to travel most until 1984 with 10 Linking Words
million
to 20,000 Use synonyms
million
. In the details, next four decades, a large number population grew continuously and touched a high of approximately 50, 000 Use synonyms
million
people. Use synonyms
Likewise
, a similar trend with some fluctuations, rising from a significant proportion (roughly 8 Linking Words
million
) to 19,000 populations.
In 1999, Spain and France’s countries attracted more than the rest nations with around 8 and 12 Use synonyms
million
correspondingly. The rest of the countries were least popular, followed by Turkey, Greece and the USA. (around 3 – 4 Use synonyms
million
).Use synonyms