
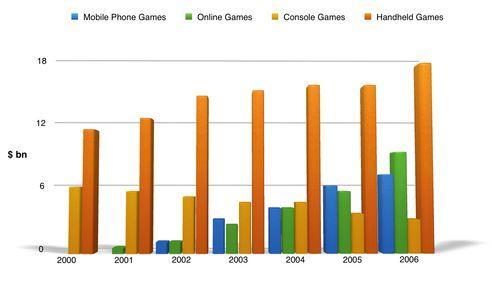
The bar chart illustrates the universal sales rate of various virtual
games
(Mobile phone Use synonyms
games
, online Use synonyms
games
, console Use synonyms
games
, and handheld Use synonyms
games
) from the Use synonyms
year
2000 to 2006.
Use synonyms
Overall
, it is visible that console Linking Words
games
have decreased over the years and the rest all the categories have increased every Use synonyms
year
.
Use synonyms
To begin
,with the comparison between the surplus and the deficit of the given categories, handled Linking Words
games
, online Use synonyms
games
and mobile phone Use synonyms
games
have outraced by a certain percentage every Use synonyms
year
, only console Use synonyms
games
have down-raced.
People start playing mobile Use synonyms
games
in the Use synonyms
year
2002, as prior to that they were no cell phones available with Use synonyms
such
updates. ,Linking Words
,
Change the punctuation
apply
Linking Words
However
it increased gradually every Add a comma
,However
year
and reached up to 8 Use synonyms
billion
$.
Online Use synonyms
games
were introduced in the Use synonyms
year
2001, and same as mobile phone Use synonyms
games
, online Use synonyms
games
Use synonyms
also
boost every Linking Words
year
and almost crossed 8 Use synonyms
billion
$. Above of all handheld game stands different in the whole chart and kept on increasing each Use synonyms
year
and reached 17 Use synonyms
billion
$ approximately
Use synonyms
In addition
, Console Linking Words
games
went to decreasing from about 5 Use synonyms
billion
$ in the Use synonyms
year
2000 to somewhere around 2 Use synonyms
billion
$ in the Use synonyms
year
2006.Use synonyms