
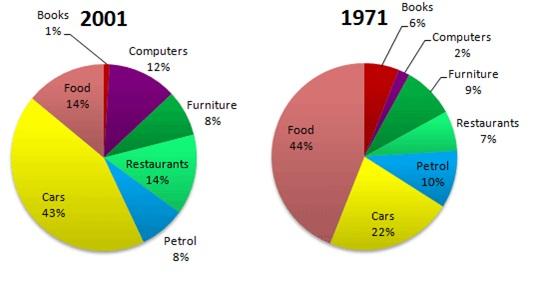
The pie chart describes how the UK citizens spent on their habits in the years 1971 and 2001
Overall
, when we compare both the year, the least preferred habit of the population Linking Words
are
purchasing books, and mostly spending on food.
Correct subject-verb agreement
is
To begin
,with categories which were down raced, 6% of the community Linking Words
use
to spend on books in 1971, which decreased by 5% in 2001. Furniture was purchased by 9% in 1971, which significantly decreased by 1%. The use of petrol in the year 1971 was 10% which slightly declined by 2% in 2011. The communities enjoyed the most having food at 44%, but it is drastically decreasing by 30% in 2001
Replace the word
used
While
discussing the expenditure which outraced when compared both the year, only 2% of crowd used the computers in 1971, which increased by 10% in 2001. family visiting restaurants in 1971 Linking Words
was
7% which exactly doubled in 2001. 22% of the public preferred cars which increased by 43% in 2001.Change the verb form
were