The graph below gives information about changes in the birth and death rates in New Zealand between 1901 and 2101.Summarize the information by selecting and reporting the main features, and make comparisons where relevant.

The graph below gives information about changes in the birth and death rates in New Zealand between 1901 and 2101.Summarize the information by selecting and reporting the main features, and make comparisons where relevant.
The picture provides
Correct article usage
a figure
show examples
figure
Fix the agreement mistake
figures
show examples
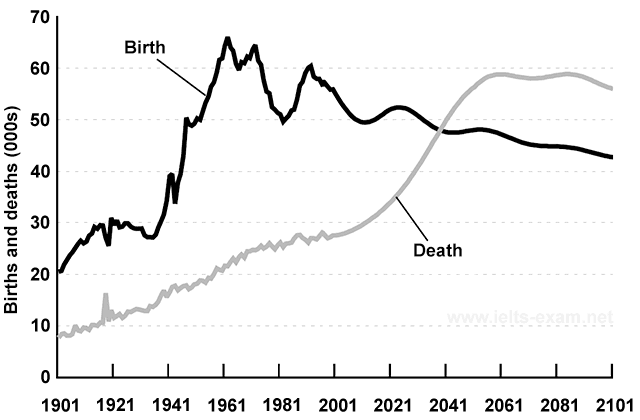
about demographic changes in New Zealand over a hundred-year period. The
birth
line is higher than the
death
line before 2041. In 1901
birth
rate
is higher than the
death
rate
of
Change preposition
by
show examples
about 10%.And
birth
rate
continue to increase and reach a peak of about 65% in 1961.In the same year, we have the biggest gap of about 40%. In 1981 the
birth
rate
go down for one year and recovered
next
Correct article usage
the next
show examples
year. The
birth
rate
only goes down since 2001, and
reach
Correct subject-verb agreement
reaches
show examples
the same in 2041. the
death
rate
steadily increases before 2001. Since the
death
rate
increases faster than before and
reach
Change the verb form
reaches
show examples
the highest point at almost 60% in 2061, by
then
the
death
rate
is higher than the
birth
rate
of about 15%.
Submitted by supervzxx on

Unauthorized use and/or duplication of this material without express and written permission from this site’s author and/or owner is strictly prohibited. Excerpts and links may be used, provided that full and clear credit is given to Writing9 with appropriate and specific direction to the original content.

Sentences: Add more complex sentences.
Linking words: Add some linking words.
Linking words: Add more linking words.
Introduction: The introduction is missing.
Introduction: The chart intro is missing.
Common mistake: Your writing should be 150-250 words.
Basic structure: Change the second paragraph.
Introduction: The chart intro is missing.
Vocabulary: Replace the words birth, death, rate with synonyms.
Vocabulary: The word "go down" was used 2 times.
Vocabulary: The word "increase" was used 3 times.
Vocabulary: The word "reach" was used 3 times.
Vocabulary: The word "about" was used 5 times.
Vocabulary: Use several vocabularies to present the data in the second paragraph.
What to do next:
Look at other essays: