
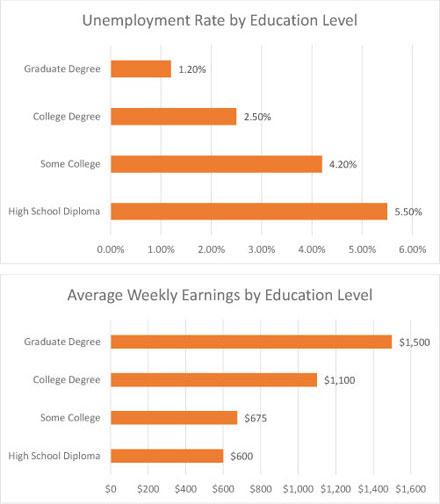
The bar diagram illustrates the relationship between academic qualification and
and
employment and Remove the redundancy
apply
also
compares the proportion of jobless people and their incomes in terms of their degrees.
Linking Words
Overall
, graduates are highly paid and Linking Words
less
job seekers Change the quantifier
fewer
Linking Words
then
others who cannot complete their university level. Replace the word
than
On the other hand
, the rate of unemployment is massive among High School degree Linking Words
holders
Use synonyms
as well as
they are the least wage earners.
To start with, the two-degree Linking Words
holders
who earn more than others are University and college pass outs. Use synonyms
Whereas
2.5% of College degree Linking Words
holders
are employed and earn 1100 USD per week, 1.29% of graduates are involved in jobs and income 1500 USD Use synonyms
in
a week.
Change preposition
apply
In contrast
, the rate is significantly lower among the students of some colleges and high Linking Words
school
pass outs. First of all, 4.2 0% of students Fix the agreement mistake
schools
of
some colleges are jobless and their weekly incomesChange preposition
in
.
are around 675 American Dollars. Add a missing verb
are.
Finally
, High School degree Linking Words
holders
are paid $600, Use synonyms
although
5.50% Linking Words
people
among them are looking for Change preposition
of people
employments
.
Fix the agreement mistake
employment
To conclude
, people who have University degrees are mostly working and earn more than others.Linking Words