
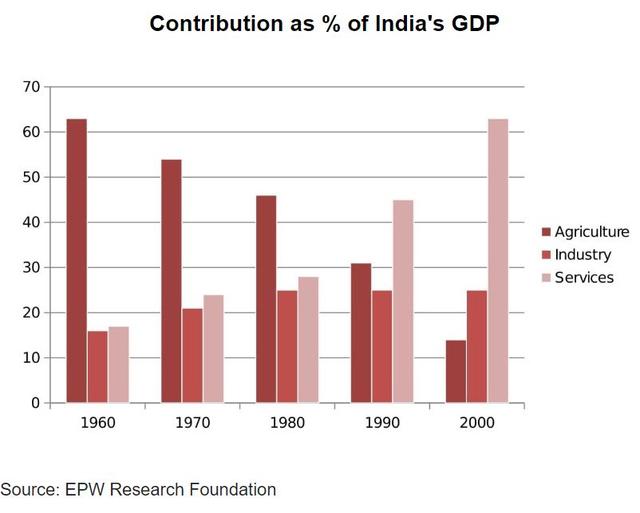
The bar graph illustrates the relative
percentage
contributions made by the agricultural, industrial and service sectors to the Indian economy between 1960 and 2000.
Over the whole time period, the significance of agriculture declined steadily Use synonyms
while
services grew in importance decade by decade. A different Linking Words
patterned
emerged for industry, which Replace the word
pattern
initially
showed a slowly increasing Linking Words
percentage
but Use synonyms
then
plateaued from 1980 onwards.
In 1960, agriculture contributed by far the highest Linking Words
percentage
of GDP, peaking at 62%, but it Use synonyms
then
dropped in steady increments to a low of 12% in 2000. The service sector, Linking Words
on the other hand
, had a relatively minor impact on the economy in 1960. Linking Words
This
situation changed gradually at Linking Words
first,
Linking Words
then
its Linking Words
percentage
contribution jumped from 28% to 43% between 1980 and 1990. By 2000 it matched the high point reached by agriculture in 1960, showing a reversal in the Use synonyms
overall
trend.
Industry remained a steady contributor to India’s wealth throughout the period. As a sector, it grew marginally from 16% in 1960 to exactly a quarter in 1980 Linking Words
then
remained static for the next two decades, maintaining a constant share of the Linking Words
overall
GDP.Linking Words