
This
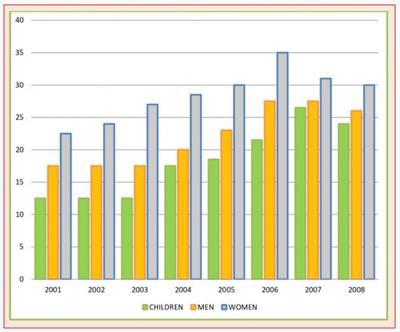
bar chart displays the proportion of British Linking Words
children
and adults consuming five portions of fruit and vegetables on a daily basis between 2001 and 2008.
Use synonyms
Overall
, the chart shows a steady increase in consumption of these Linking Words
health
foods in both the juvenile and adult population between 2001 and 2006, followed by a slight drop in the years after. In spite of Replace the word
healthy
this
Linking Words
overall
increase, the Linking Words
percentage
of Use synonyms
children
who eats five portions of greens and fruits a day is considerably lower than the Use synonyms
percentage
of Use synonyms
the
adult males and significantly lower than that of adult females.
A closer look at the data for Correct article usage
apply
children
reveals that their Use synonyms
percentage
remained steady at just above 10% between 2001 and 2003, after which it increased significantly until 2007 when it peaked at approximately 25%. Use synonyms
This
was Linking Words
then
followed by a slight drop of only a few Linking Words
percentage
points in the final year.
Zooming in on the percentages of adults, it can be noted that men followed a very similar trend to that of Use synonyms
the
Correct article usage
apply
children
. The figures for males remain stable at just over 15% in the first three years of the period. After that, the percentages climbed to their highest point of more than a quarter of the population in 2006. Use synonyms
This
level was Linking Words
also
reached in 2007, after which there was a slight decline to just slightly above 25% in 2008.
The trends in female adults show a steady increase from about 20% in 2001 to Linking Words
a
about 35% in 2006. The numbers Correct article usage
apply
then
slightly dropped again in the following two years to around 30% in 2008.Linking Words