
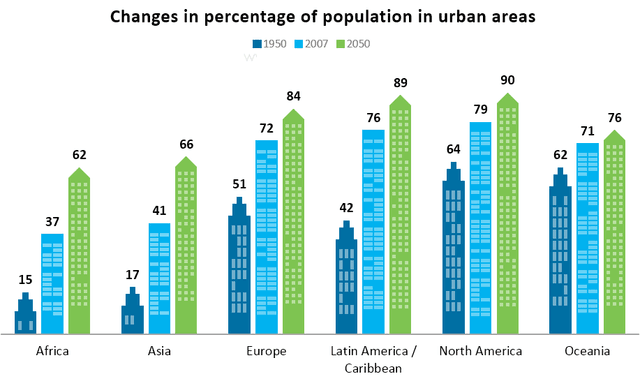
The bar graph gives
previous
ratio and Change the article
the previous
also
depicts the future percentage of people living in six different countries namely, Linking Words
asia
, Change the capitalization
Asia
africa
, Europe, Change the capitalization
Africa
latin
Change the capitalization
Latin
America
and Use synonyms
Use synonyms
oceania
in three different years (1950, 2007, 2050).
Change the capitalization
Oceania
Overall
, the highest percentage of Linking Words
Use synonyms
population
belongs to Add an article
the population
north
Change the capitalization
North
America
(64%, 79%, 90%) Use synonyms
whereas
Africa has the lowest percentage of Linking Words
Use synonyms
population
in 1950 and in 2007 Add an article
the population
however
, the rate will increase to 62% in 2050 but it will still be less from the other six countries.
It is clear from the data shown in the graph, the Linking Words
population
of Europe and Use synonyms
latin
Change the capitalization
Latin
America
was above 40% in 1950 and raised to Use synonyms
70’s
in 2007.In 2050,Fix apostrophe usage
’70s
however
,it is expected that the Linking Words
population
of both Use synonyms
the
nations will exceed 83% .The Correct article usage
apply
population
of Use synonyms
north
Change the capitalization
North
America
and Use synonyms
Use synonyms
oceania
was below 65% in 1950.the rate raised to Change the capitalization
Oceania
to
79% in Remove the redundancy
apply
north
Change the capitalization
North
America
and 76% in Use synonyms
Use synonyms
oceania
in the year 2007. The expected rate of Change the capitalization
Oceania
Use synonyms
oceania
is less than Change the capitalization
Oceania
north
Change the capitalization
North
America
in 2050 (76% when compared Use synonyms
to90
%).
To illustrate, the graph shows an increase in Correct your spelling
to 90
number
of Change the article
a number
the number
Use synonyms
population
showing that Add an article
the population
Use synonyms
population
has increased over the years and it will keep on increasing till 2050.Correct article usage
the population