
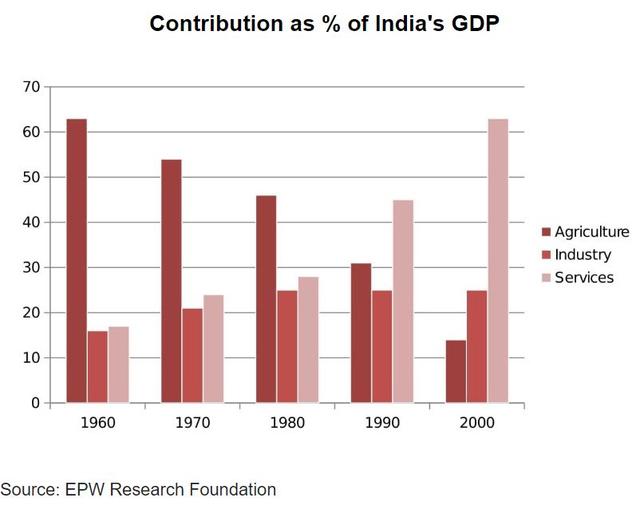
The bar chart depicts the offering of three sectors (agriculture,
industry
and services) to India's GPD from 1960 to 2000 divided into 5 different intervals.
Use synonyms
Overall
, it can be observed that agriculture was at its peak in 1960 outnumbering other sectors by a huge margin, but by that time, it kept falling and came to the bottom in 2000. Linking Words
On the other hand
, the Services sector increased sharply, Linking Words
while
the Linking Words
industry
section rose a bit, Use synonyms
then
it became steady.
In the year 1960, agriculture assisted as the highest contributor to India's GDP with a proportion of around 62% outnumbering other zones by a huge margin. Linking Words
However
, it fell significantly over the years and in the year 2000, it had the least contribution to the GDP with a percentage of just under 15. The Linking Words
industry
part had a percentage of around 16% in 1960 and it increased marginally and by the year ,1980 it assisted with 25%.
As per the graph, the services Use synonyms
industry
had least numbers in 1960 around 18% but it significantly rose over the years and in 2000 it was highest with Use synonyms
the
62%.Correct article usage
apply