The chart below shows how frequently people in the USA ate in fast food restaurants between 2003 and 2013. Summarise the information by selecting and reporting the main features, and make comparisons where relevant.

The chart below shows how frequently people in the USA ate in fast food restaurants between 2003 and 2013.

Summarise the information by selecting and reporting the main features, and make comparisons where relevant.
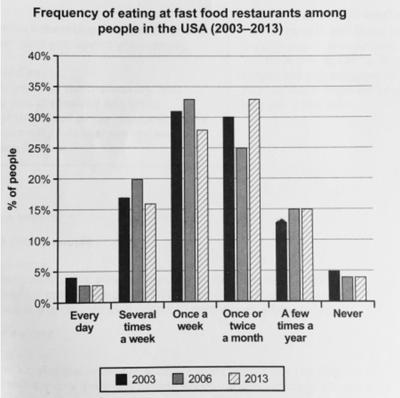
The bar chart illustrates how often the population ate in fast food restaurants in the USA from 2003 to 2013.
Overall
, a community who eat once a week and once or twice a month outnumbered other times over the years.,
Furthermore
society who eat every day and never are approximately around or under 5%. With regards to folk who eat several times a week increased by around 3% between 2003 to 2006.
Then
drastically dropped to roughly 16%. For those who eat once a week slightly rose from about 31% to nearly 33%. Later it decreased to partially 28%. The percentage of folk who eat once or twice a month fell from 30% to 25% between 2003 to 2006. After that, it sharply rose to around 8%in 2013. People who eat a few times a year in 2003 were near to 13%. In 2006 and 2013 were the same close to 15%.
Submitted by binderya9575 on

Unauthorized use and/or duplication of this material without express and written permission from this site’s author and/or owner is strictly prohibited. Excerpts and links may be used, provided that full and clear credit is given to Writing9 with appropriate and specific direction to the original content.

Sentences: Add more complex sentences.
Vocabulary: The word "around" was used 3 times.
Topic Vocabulary:
  • fast food consumption
  • dining frequency
  • decade overview
  • trend analysis
  • to dine out
  • fluctuation
  • sharp increase
  • gradual decline
  • eating habits
  • statistical comparison
  • consuming pattern
  • noteworthy change
  • anomaly
  • periodic comparison
  • data interpretation
What to do next:
Look at other essays: