
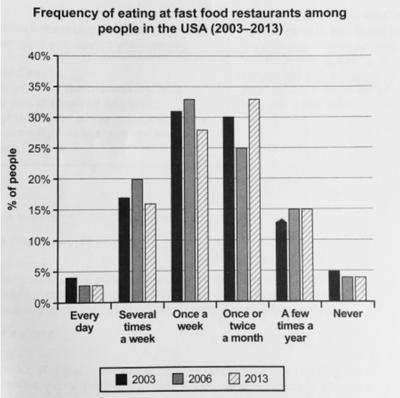
The given graph indicates the frequency of consumption at fast
food
Use synonyms
restaurants
among Use synonyms
people
in the USA during the period from 2003 to 2013. Information is shown for six different categories; Every day, Several times a Use synonyms
week
, Once a Use synonyms
week
, Once or twice a Use synonyms
month
, A few times a year, and Never.
Looking at the Use synonyms
overall
perspective, it is readily apparent that the different percentages were seen among all the listed figures. Linking Words
In addition
, for a decade between 2003 and 2013, the proportion of Linking Words
people
eating fast Use synonyms
food
in Use synonyms
restaurants
once a Use synonyms
week
and once or twice a Use synonyms
month
showed larger figures than others, especially in 2013, over 30% of Use synonyms
people
in the USA consume in fast Use synonyms
food
Use synonyms
restaurants
once or twice a Use synonyms
month
.
When it comes to Americans who eat at fast Use synonyms
food
Use synonyms
restaurants
once a Use synonyms
week
, they account for the biggest rate between 2003 and 2006, and in 2013, the ratio of Use synonyms
people
eating at Use synonyms
restaurants
once or twice a Use synonyms
month
showed a similar figure Use synonyms
with
the figure standing over 30%.
Meanwhile, during the given period, the least percentage of Change preposition
to
people
consumed fast Use synonyms
food
in Use synonyms
restaurants
every day, and the figure of Use synonyms
people
who never experienced fast Use synonyms
food
at Use synonyms
restaurants
was the almost same as the ratio of Americans eating instant Use synonyms
food
every day slightly under 5%.Use synonyms