
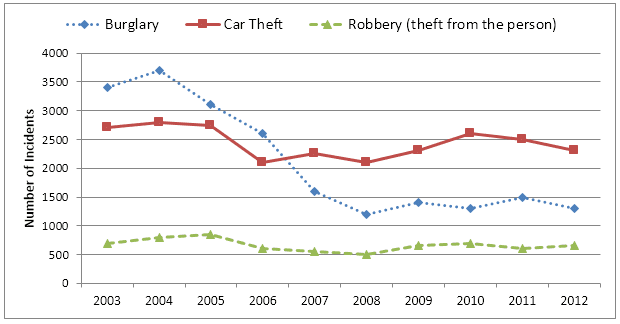
The chart gives information about the types of crime practised in the city named Newport city centre from the year 2003- 2012.
Additionally
, it provides details regarding the changes that took place in various methods.
The city has been subject to many offences like burglary, car theft, and robbery ( theft from the person). In the year ,2003 burglary had its peak Linking Words
while
Linking Words
,
by end of 2012 it was very rarely done by thieves and the highest is by car theft.
In early 2000, burglary was the major cause for the people ( 3500 incidents per annum) who came to the police stations.But later on, with increased awareness and security system , there was a steep decrease .Regarding ,robbery the rate has been nearly steady over the years as very few (less than 1000 cases) are filed as a complaint.
ThoughRemove the comma
apply
,
the number of car thefts reported decreased gradually in the year 2004, surprisingly, there was a slow rise making it the most popular act by thieves.In conclusion, the most practised mischief by criminals varied Remove the comma
apply
according to
the years and people need to follow safety measures Linking Words
accordingly
.Linking Words