
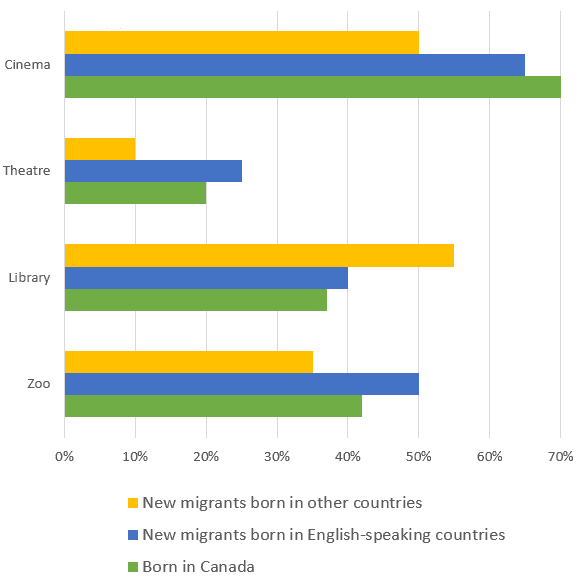
The graph illustrates the places visited by different people in Canada.
Overall
, the graph zig-zagged for all the categories.
The cinema is the most popular place in the whole graph coming at 70% but not only for citizens of Canada but throughout all the types. We Linking Words
also
can see that new migrants have the lowest percentage for the cinema at 50% Linking Words
this
can be caused by the fact they are new to the environment. The next accommodation on the list is the theatre which shows the lowest numbers in the whole diagram , having a peak at 25% for new incomers. Another location is the library where official citizens reach numbers just below 40%.Linking Words
However
, Linking Words
this
time new immigrants had the highest rate at 50 per cent.
Linking Words
Lastly
, the zoos' highest figure was new travellers from other English-speaking countries exactly at 50%. And coming, at Linking Words
last
,Linking Words
last
was the natives' coming in at around 40%Linking Words