
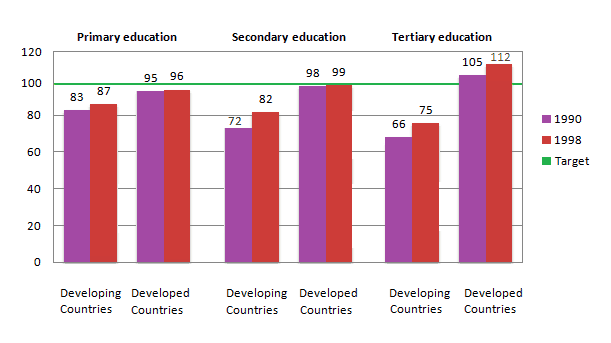
The given bar chart illustrates how many female out of 100 male students attended three different stages of education, from primary to university in both developing and developed countries in the two years 1990 and 1998.
In general , there was an upward trend in all levels in 1998 compared to the year 1990.
Similarly
, the total of girls involved in training in affluent nations was much higher than in the poor ones, Linking Words
while
it was significantly noticeable in higher education, the figure was more than the target.
Regarding the statistics of the feminine group in developing countries, it seems evident that it always followed an unstable trend. To be more specific, in 1990, that data was relatively small, there were 83 pupils participating in primary teaching, much more than the two other levels, secondary and universities, by 11 and 17 learners. Linking Words
In addition
, a similar pattern can be seen in the year 1998, when the number of females decreased among the three categories. Elementary schools recorded the highest figure, at 87 pupils, followed by 82 and 75 students in the other types.
Turning to the well-off nations, there was a relative increase between the two years in all levels, 1 student in the primary and secondary study, reached the number of 96 and 99 pupils in 1998 respectively. Linking Words
However
, in universities, that figure was much more considerable, from 105 in 1990 to 112 students in 1998.Linking Words