
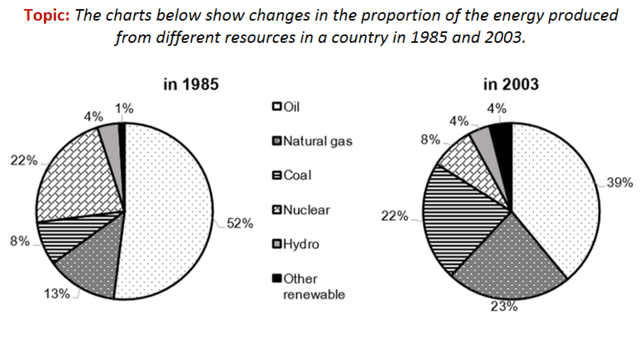
The charts illustrate the percentages of
energy
generated from five particular Use synonyms
resources
and other recyclable Use synonyms
resources
in a nation in 1985 and 2003. It is evident that the power contribution of oil occupied the most in both years Use synonyms
while
recycled Linking Words
resources
were allocated the least in 1985, Use synonyms
although
it raised by a minimal amount in 2003.
Regarding oil, it provided marginally over half of the Linking Words
energy
in 1985, and its proportion declined by thirteen per cent in 2003, Use synonyms
although
it was the most reliable Linking Words
energy
source of all time. Use synonyms
Similarly
, nuclear Linking Words
energy
accounted for only 8 per cent in 2003, after providing slightly over one-fifth of Use synonyms
energy
produced across the country in 1985.
Use synonyms
On the contrary
, the Linking Words
energy
manufacturings by coal and natural gas were in opposite trend. Use synonyms
Although
coal supported only 8% of Linking Words
energy
in 1985, it increased to 22% in 2003. At the same time, Use synonyms
energy
generation by natural gas Use synonyms
also
grew by 10%. Linking Words
However
, hydro remained constant at 4 per cent, the same proportion of Linking Words
energy
generated by other recycled Use synonyms
resources
in 2003.Use synonyms