
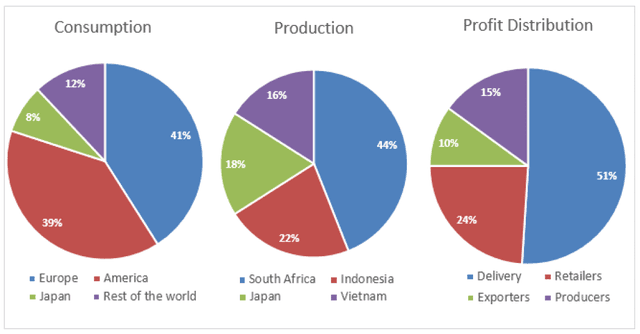
The given pie charts compare the production and consumption of countries all around the world, and the factor considers where the profit of the coffee industry goes. The largest percentage of production and related to America and Europe, and the most significant percentage of profit distribution belong to delivery.
According to
the data on consumption and production, Japan is in common of two factors with 8% and 18% respectively. The percentage of America and Europe as the important countries for consumption is 39% and 41%.
Linking Words
Moreover
, there are not a lot of countries exist that have a role to produce coffee. In South Africa, Indonesia, Vietnam and Japan the percentages were 44%,22%,18%, and 16%, respectively. And the most important profit of distribution Linking Words
coffee
is delivery with 51%.Change preposition
of coffee