
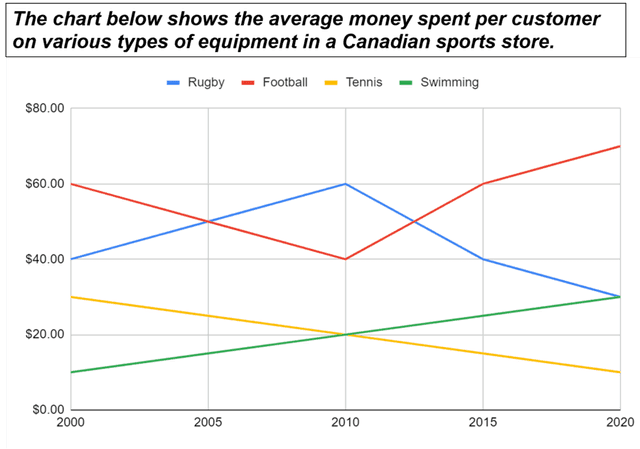
The line graph illustrates information about how much money per customer spent on rugby, tennis, football and swimming equipment in one unspecified sports store in Canada. The units were measured in dollars for a 2-decade period starting from 2000.
Overall
, Linking Words
it is clear that
average spending on swimming and football tools increased over the period shown. Linking Words
However
, Linking Words
costumers
started allocating less money to equipment for rugby and tennis.
When the period began, Correct your spelling
customers
costumers
used to spend $60 on buying the necessary stuff for football. Despite a sharp decline to $40 in the following decade, Correct your spelling
customers
this
figure went up exponentially to reach a peak of approximately $70 and become dominant in the group in 2020. Linking Words
Furthermore
, the same data for swimming experienced an uptake from its initial around $10 to the final 30.
In stark contrast, Linking Words
although
the Linking Words
costumer’s
average spending on rugby equipment rose by $20 from $40 between 2000 and 2010, it halved till the final year. The same figure for tennis tools Correct your spelling
customer’s
also
decreased from $30-2000 to $10-2020, showing the least amount.Linking Words