
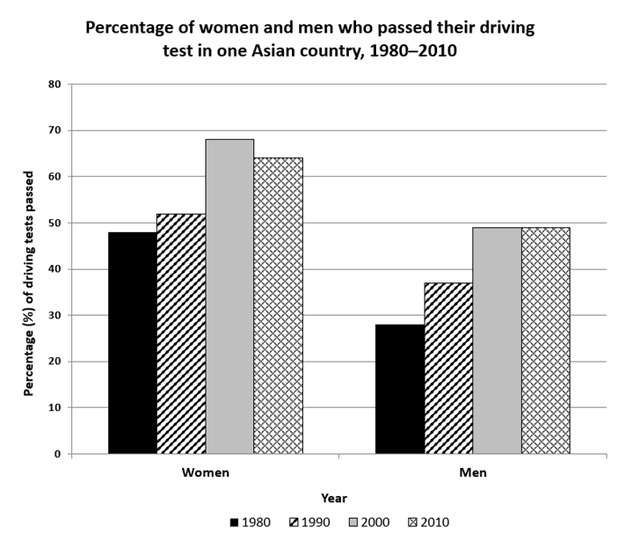
The bar graphs illustrate two distinct groups (men and women) who passed their driving exam, the frame time presented is every ten years from 1980 to 2010 in an Asian country.
Overall
, the proportion of women applicants supersedes the number of men. Linking Words
Moreover
, for both sexes, 1980 was the year with less amount of passes.
In Linking Words
this
context, the female sex had a gradual increase between 1980 and 1990, whilst in 2000 the chart has shown a surge and in 2010 a slight decrease.
Linking Words
In addition
, the male chart had a moderate rise, albeit, the lower percentage of driving test passes when compared to the opposite sex. The graph remained stable from 2000 to 2010.
In Linking Words
this
context, the highest approval of females was nearly 70% Linking Words
while
the male was close to 50%
Linking Words
To sum up
, women represented predominantly the sex of people who passed their driving exams between 1980 and 2010. In spite of that, females' lowest passing statistic is equivalent to the males' highest rate.Linking Words